If you wonder about the usage and estimated costs of your Azure Kubernetes (AKS) service log analytics or the cost for monitoring data retained and data collected seem to be extremely high this blog post will help investigate the cost drivers and help identify the source.
Identify Categories
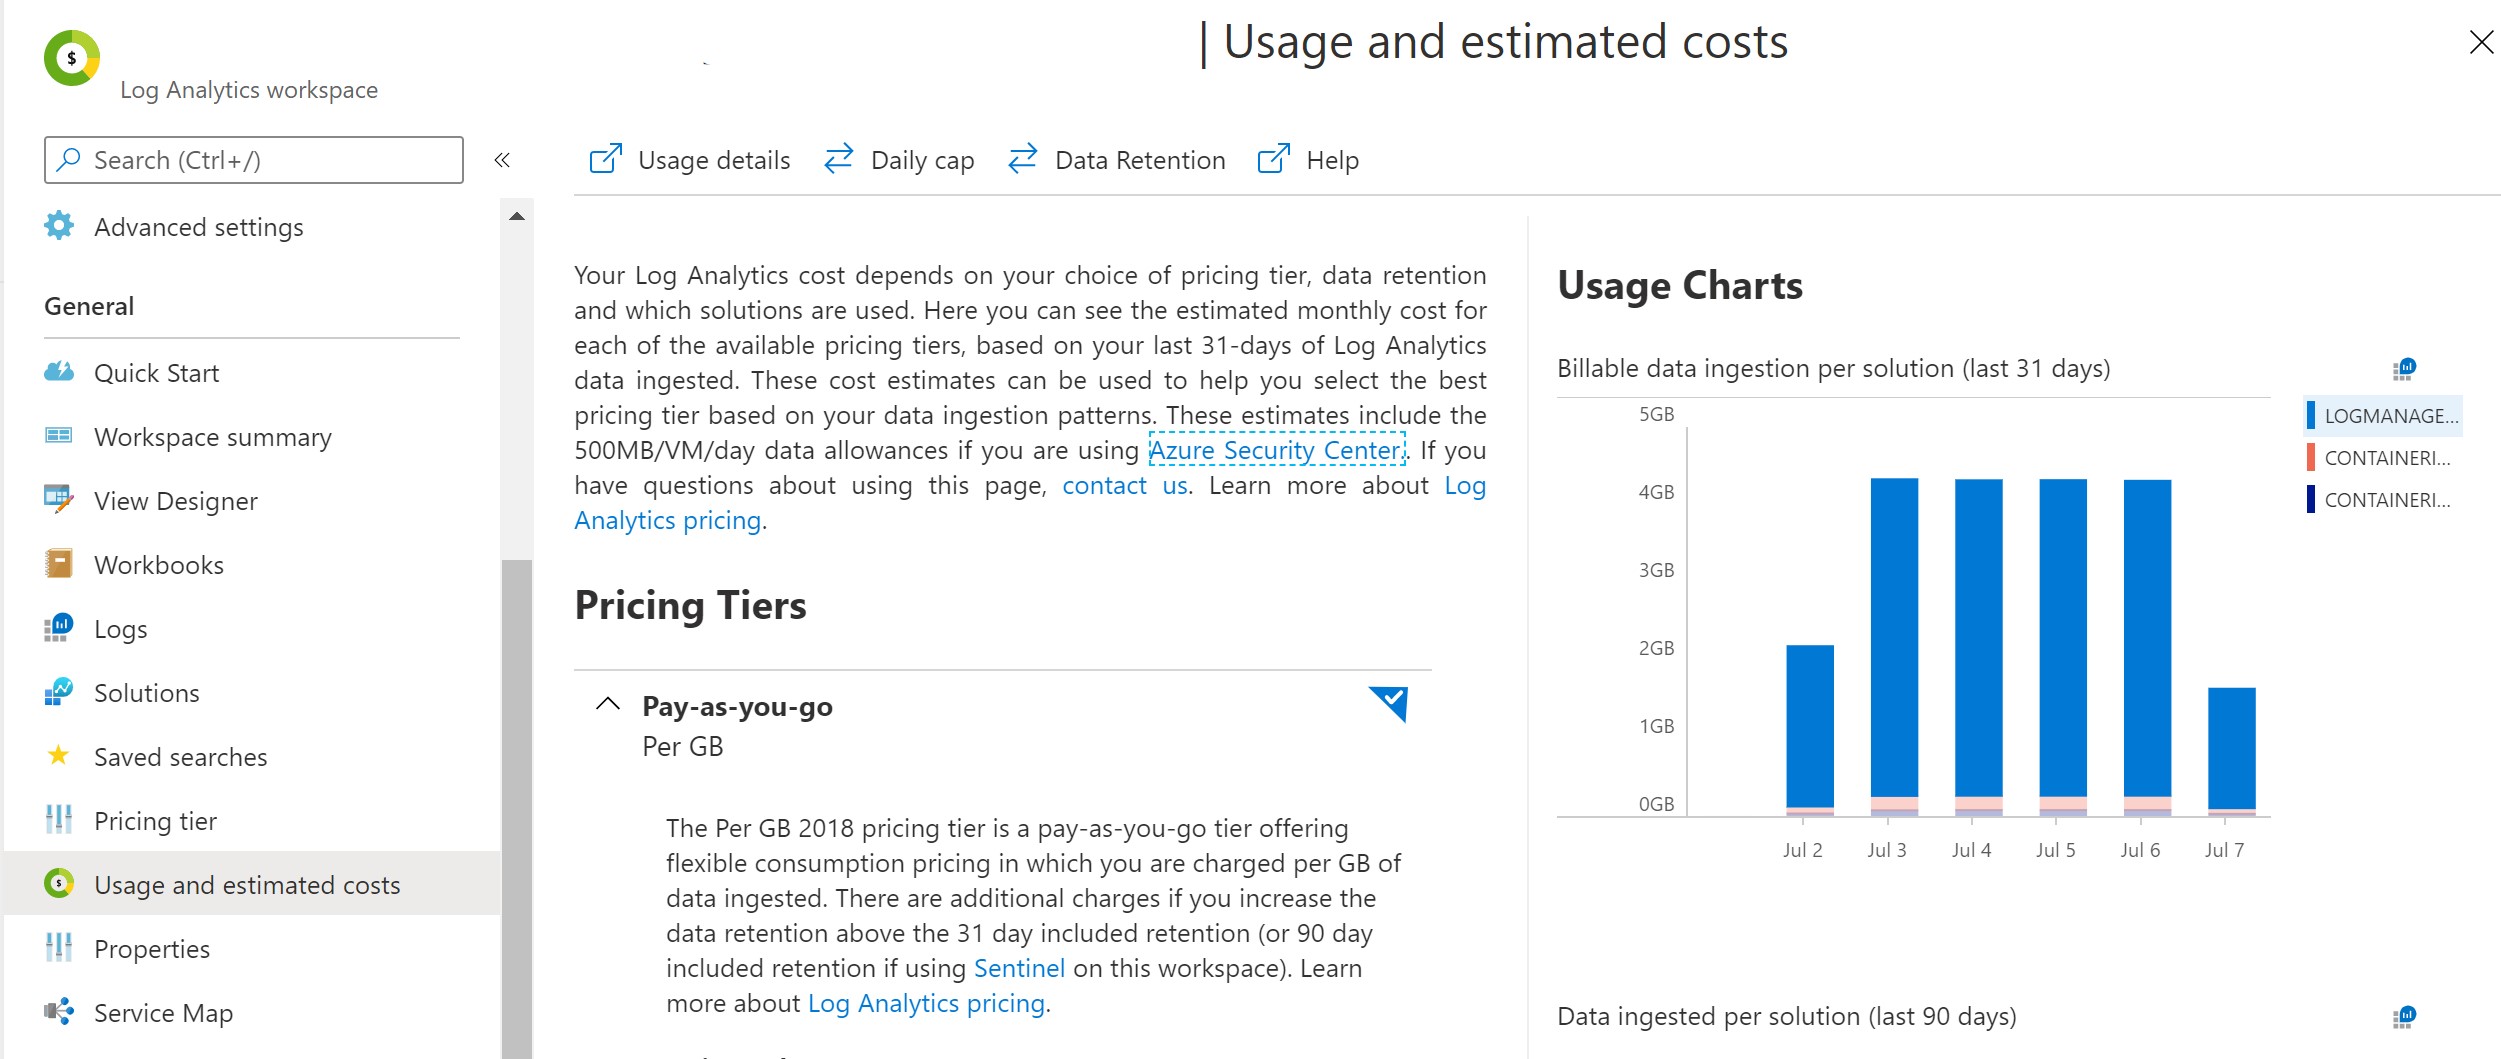
Looking at the usage and estimate the LogManagement category seems to be the biggest cost driver with 80% data retention
Drilling into the LogManagement category, we can see that AzureDiagnostics is the biggest driver.
Usage | where TimeGenerated > startofday(ago(31d))| where IsBillable == true
| where TimeGenerated > startofday(ago(31d))
| where IsBillable == true
| summarize BillableDataGB = sum(Quantity) / 1000. by bin(TimeGenerated, 1d), DataType | render barchart
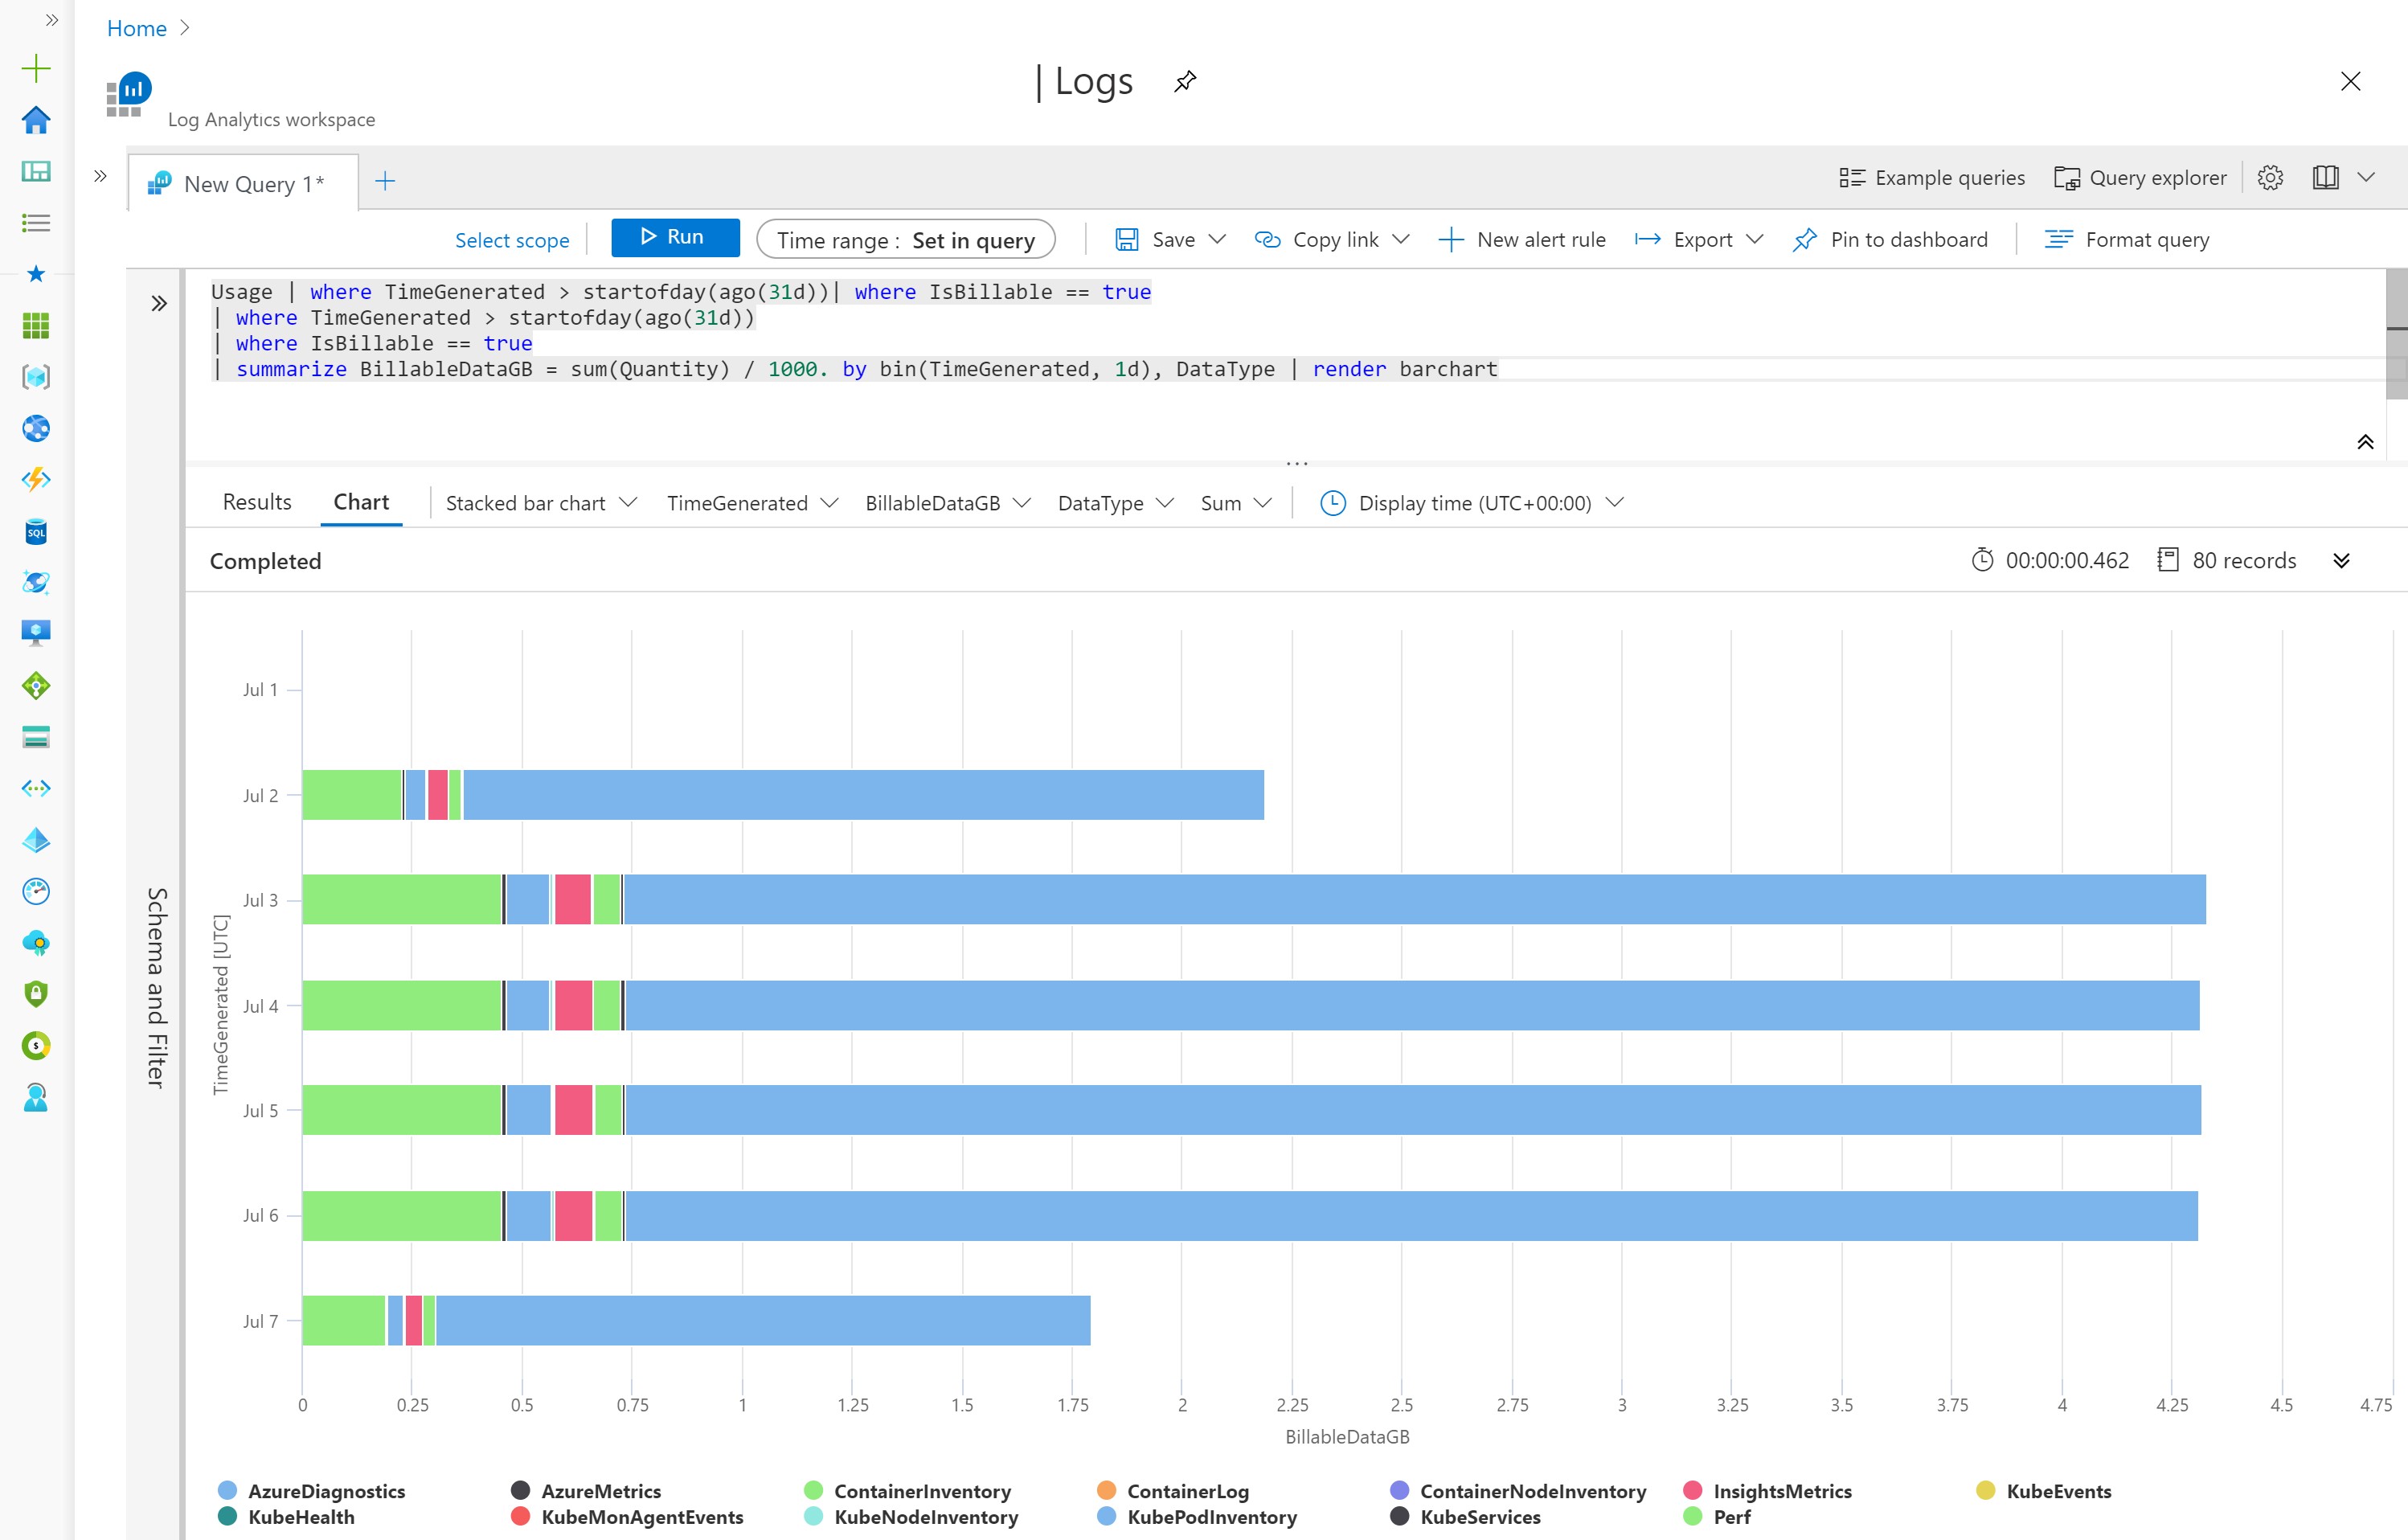
Using the follow Kusto query we can see that AzureDiagnostics has more then 15GB of BillableDataGB vs 2GB for Perf Data.
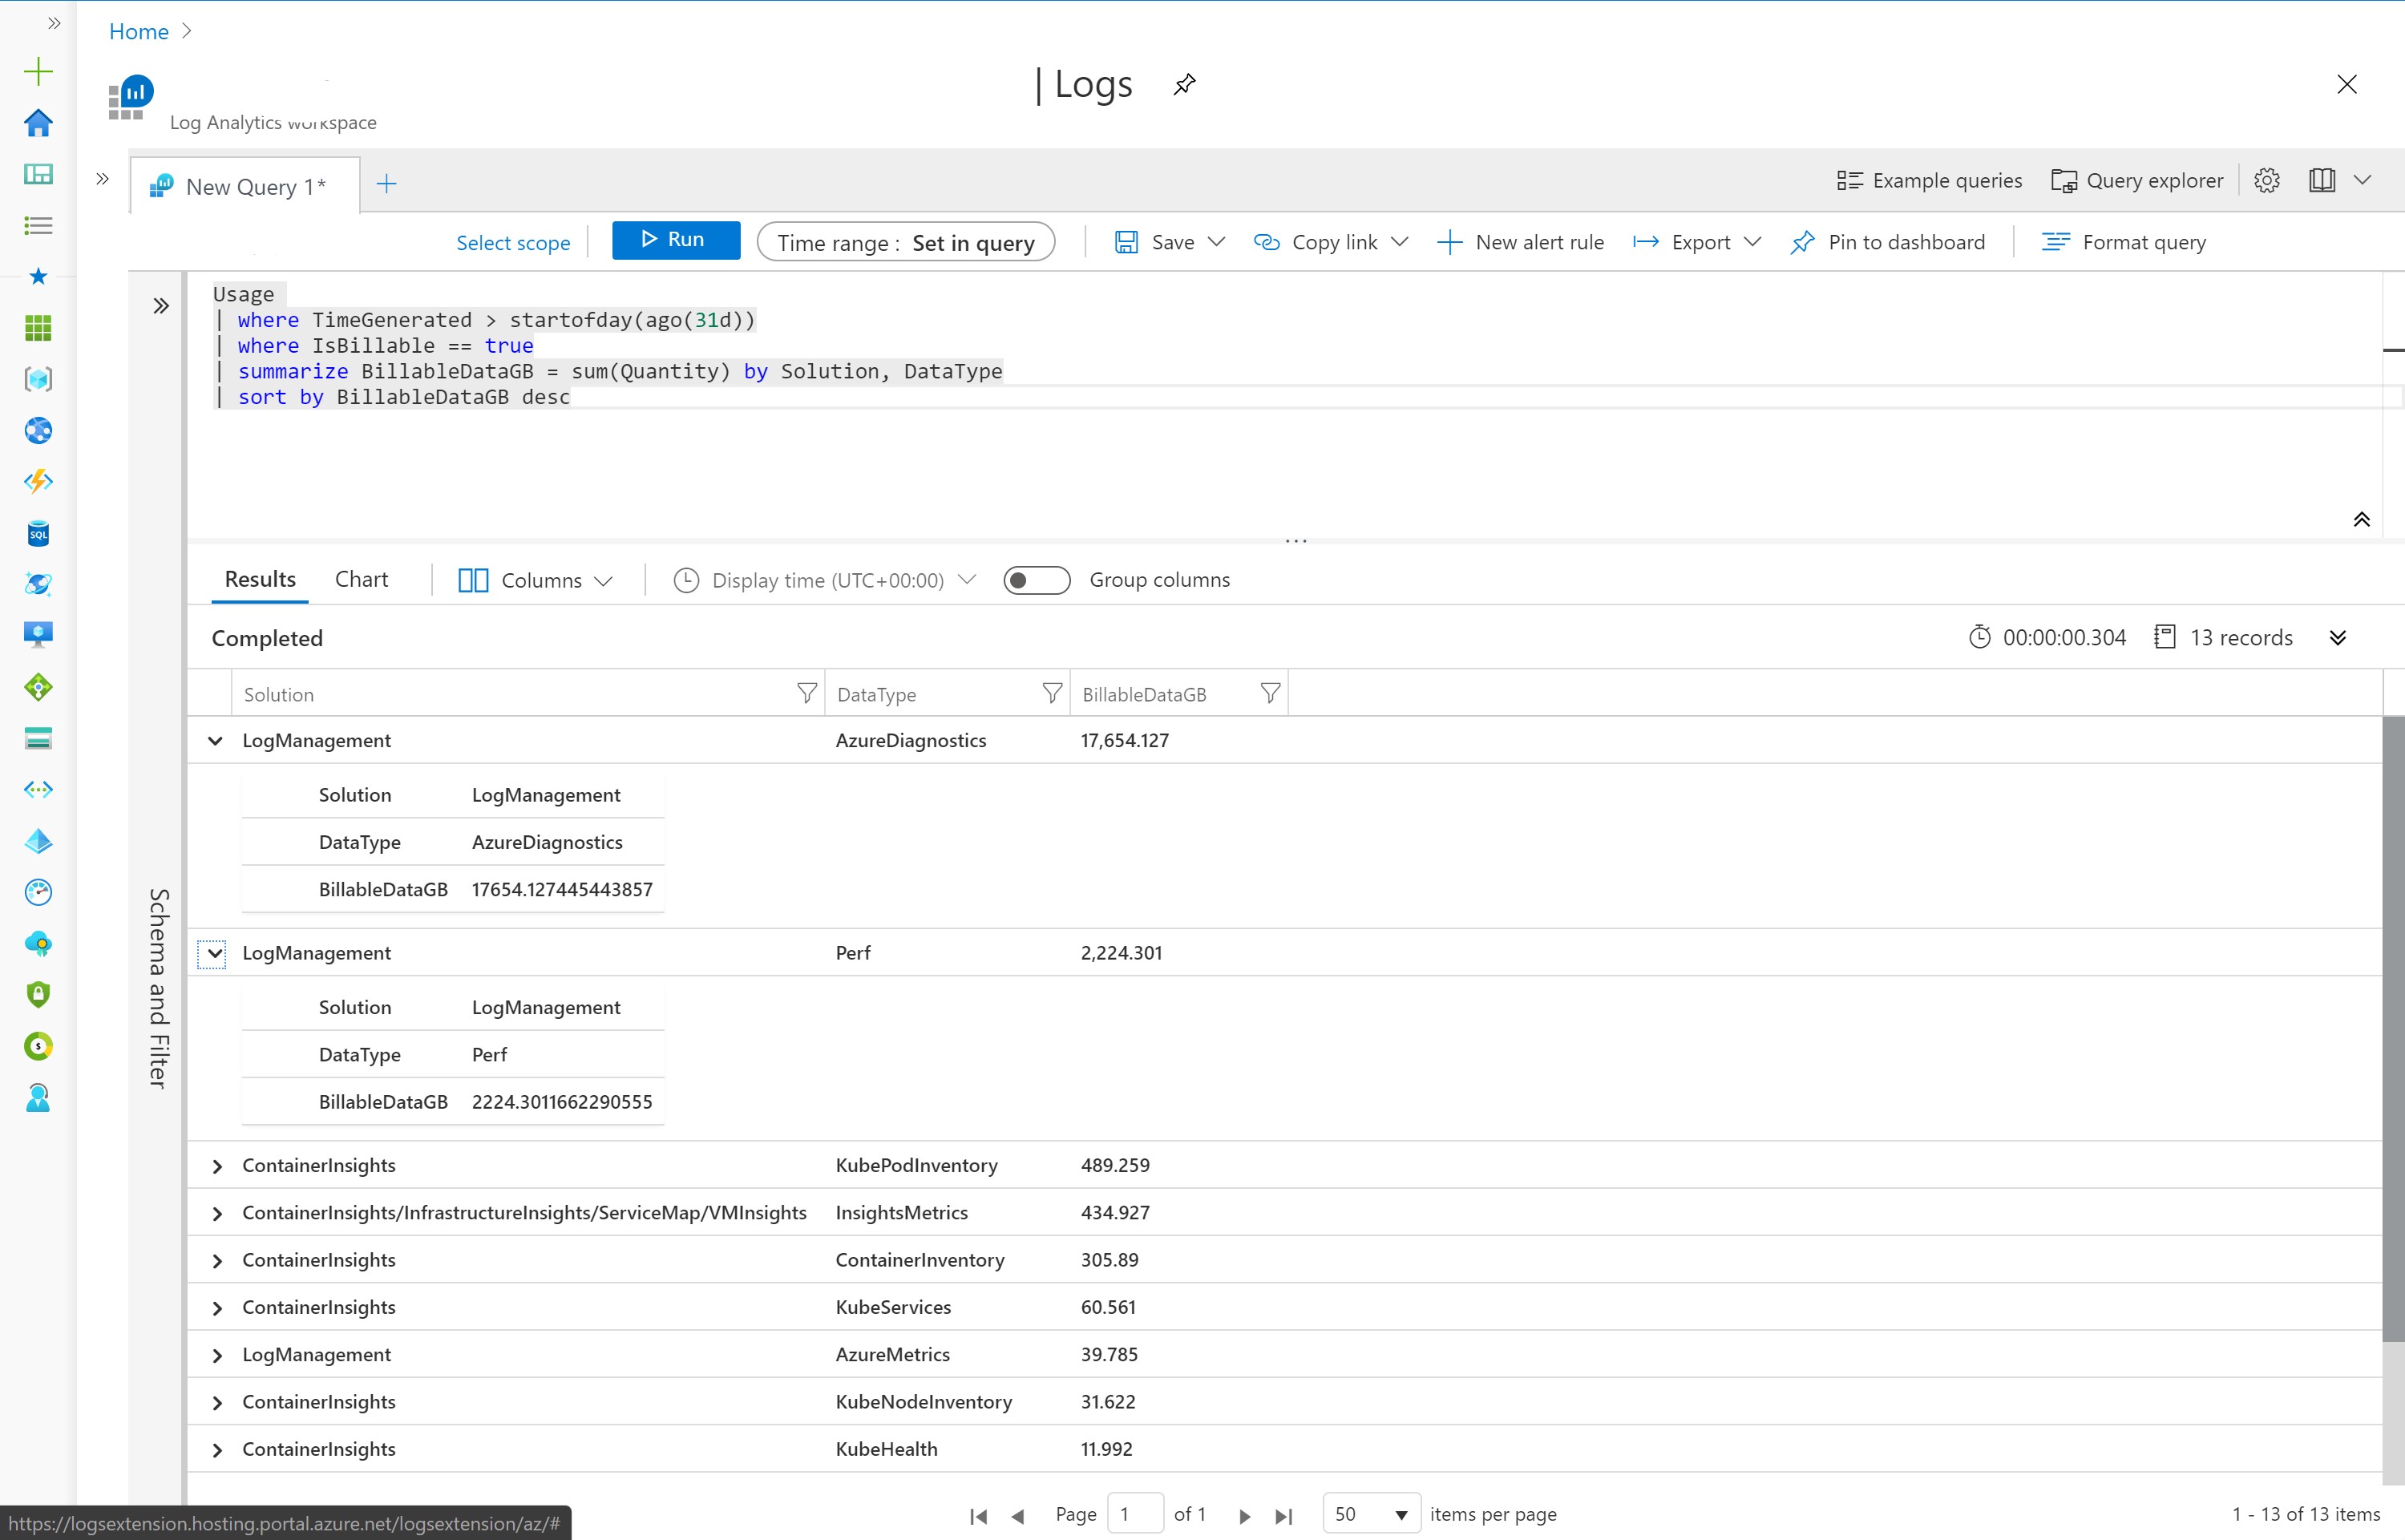
Usage
| where TimeGenerated > startofday(ago(31d))
| where IsBillable == true
| summarize BillableDataGB = sum(Quantity) by Solution, DataType
| sort by BillableDataGB desc
Identify Resource
Looking into the ResourceProvider we can see that CONTAINERSERVICE is the main contributor to the logs using
AzureDiagnostics | summarize AggregatedValue = count() by ResourceProvider, ResourceId
Result:
MICROSOFT.KEYVAULT:	8,122
MICROSOFT.CONTAINERSERVICE:	1,894,579
Identify Diagnostic Category
Inside the AzureDiagnostics logs we can investigate the log_s using
AzureDiagnostics | extend logs = parse_json(log_s) | project logs.apiVersion, logs
The logs contain the apiVersion audit.k8s.io/v1. Looking into the configured diagnostics settings of the resource group we can investigate which category is selected.
Identify K8S Namespace
Based on the logs we can create a PieChart that prints the data used per namespace in order to investigate what kind of logs are driving the biggest amount of data generated. (Thanks @Vishwanath for the query)
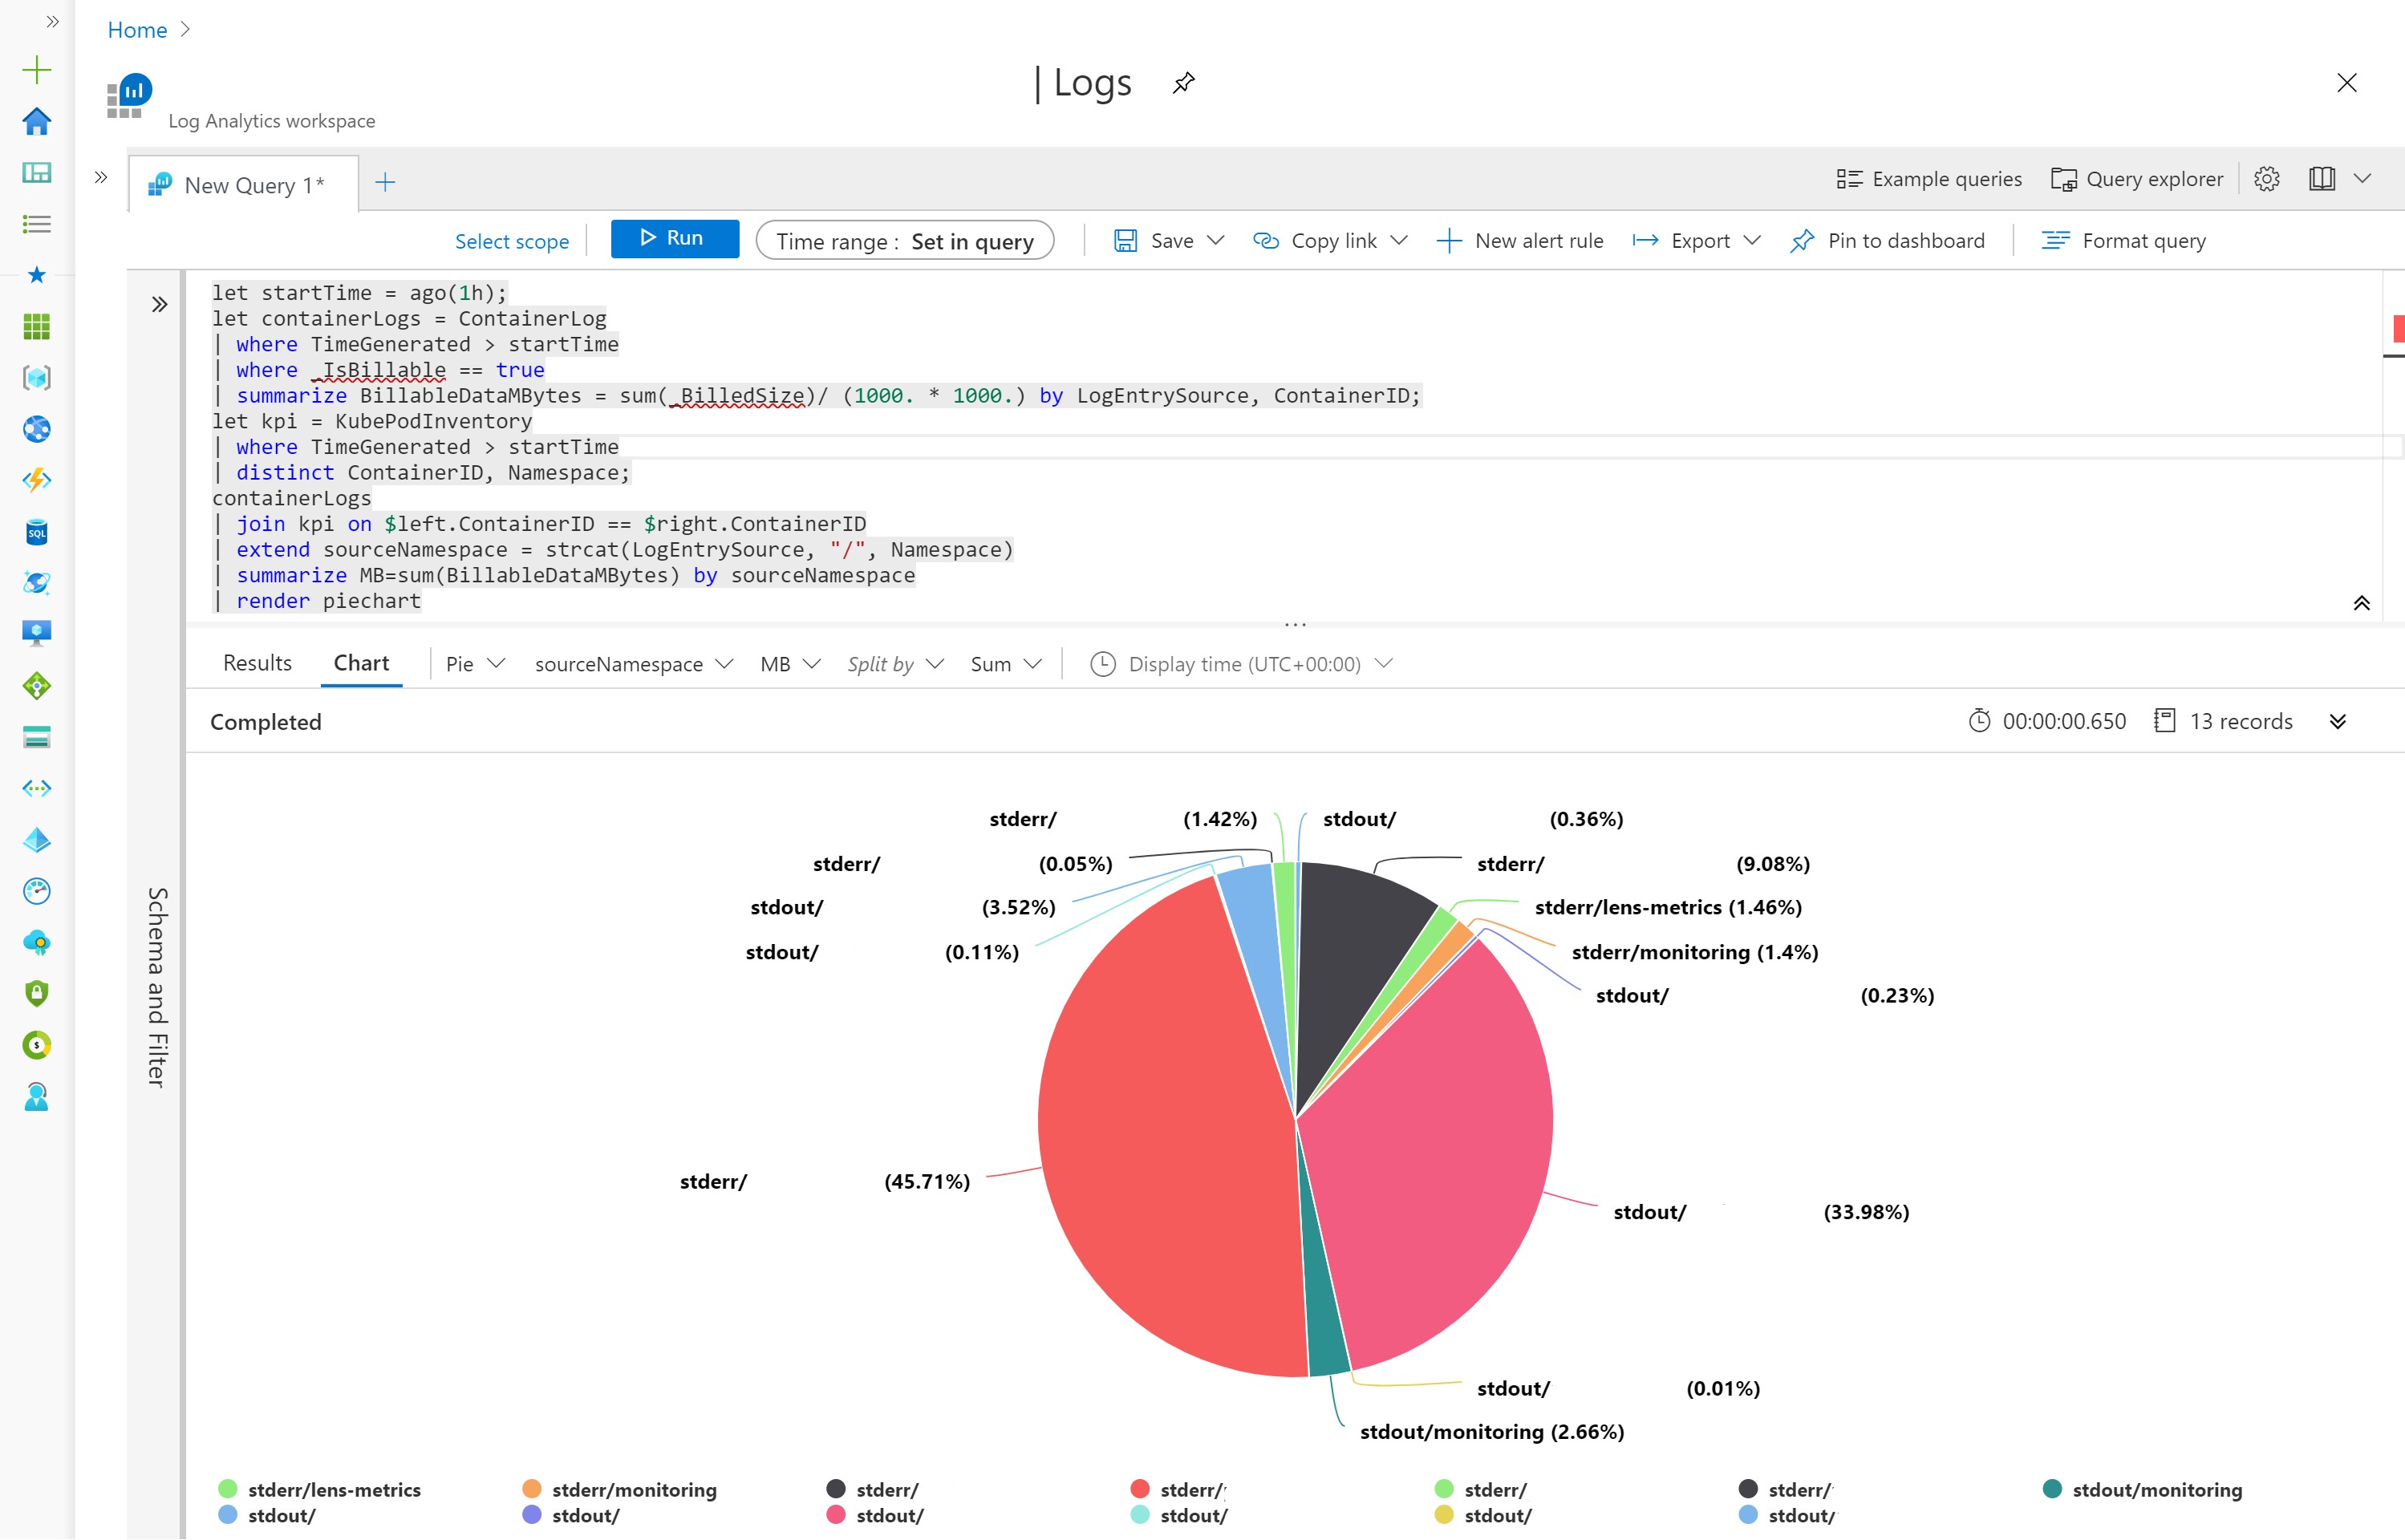
Based on the chart we can see that a lot of data is generated in the stderr and stdout of the namespaces. Now we can look into the application in the particular namespace to determine what kind of logs are being generated.
Reducing Cost
A quick fix is to turn of the diagnostics settings of the Kubernetes Service, disabling the diagnostics will not generate any further data. The data already generated will continue to be charged based on data retention.
We can tweak the applications log level or fix any error that is generate the stderr logs. A container in a constant crash loop can generate a huge amount of data if not dealt with.
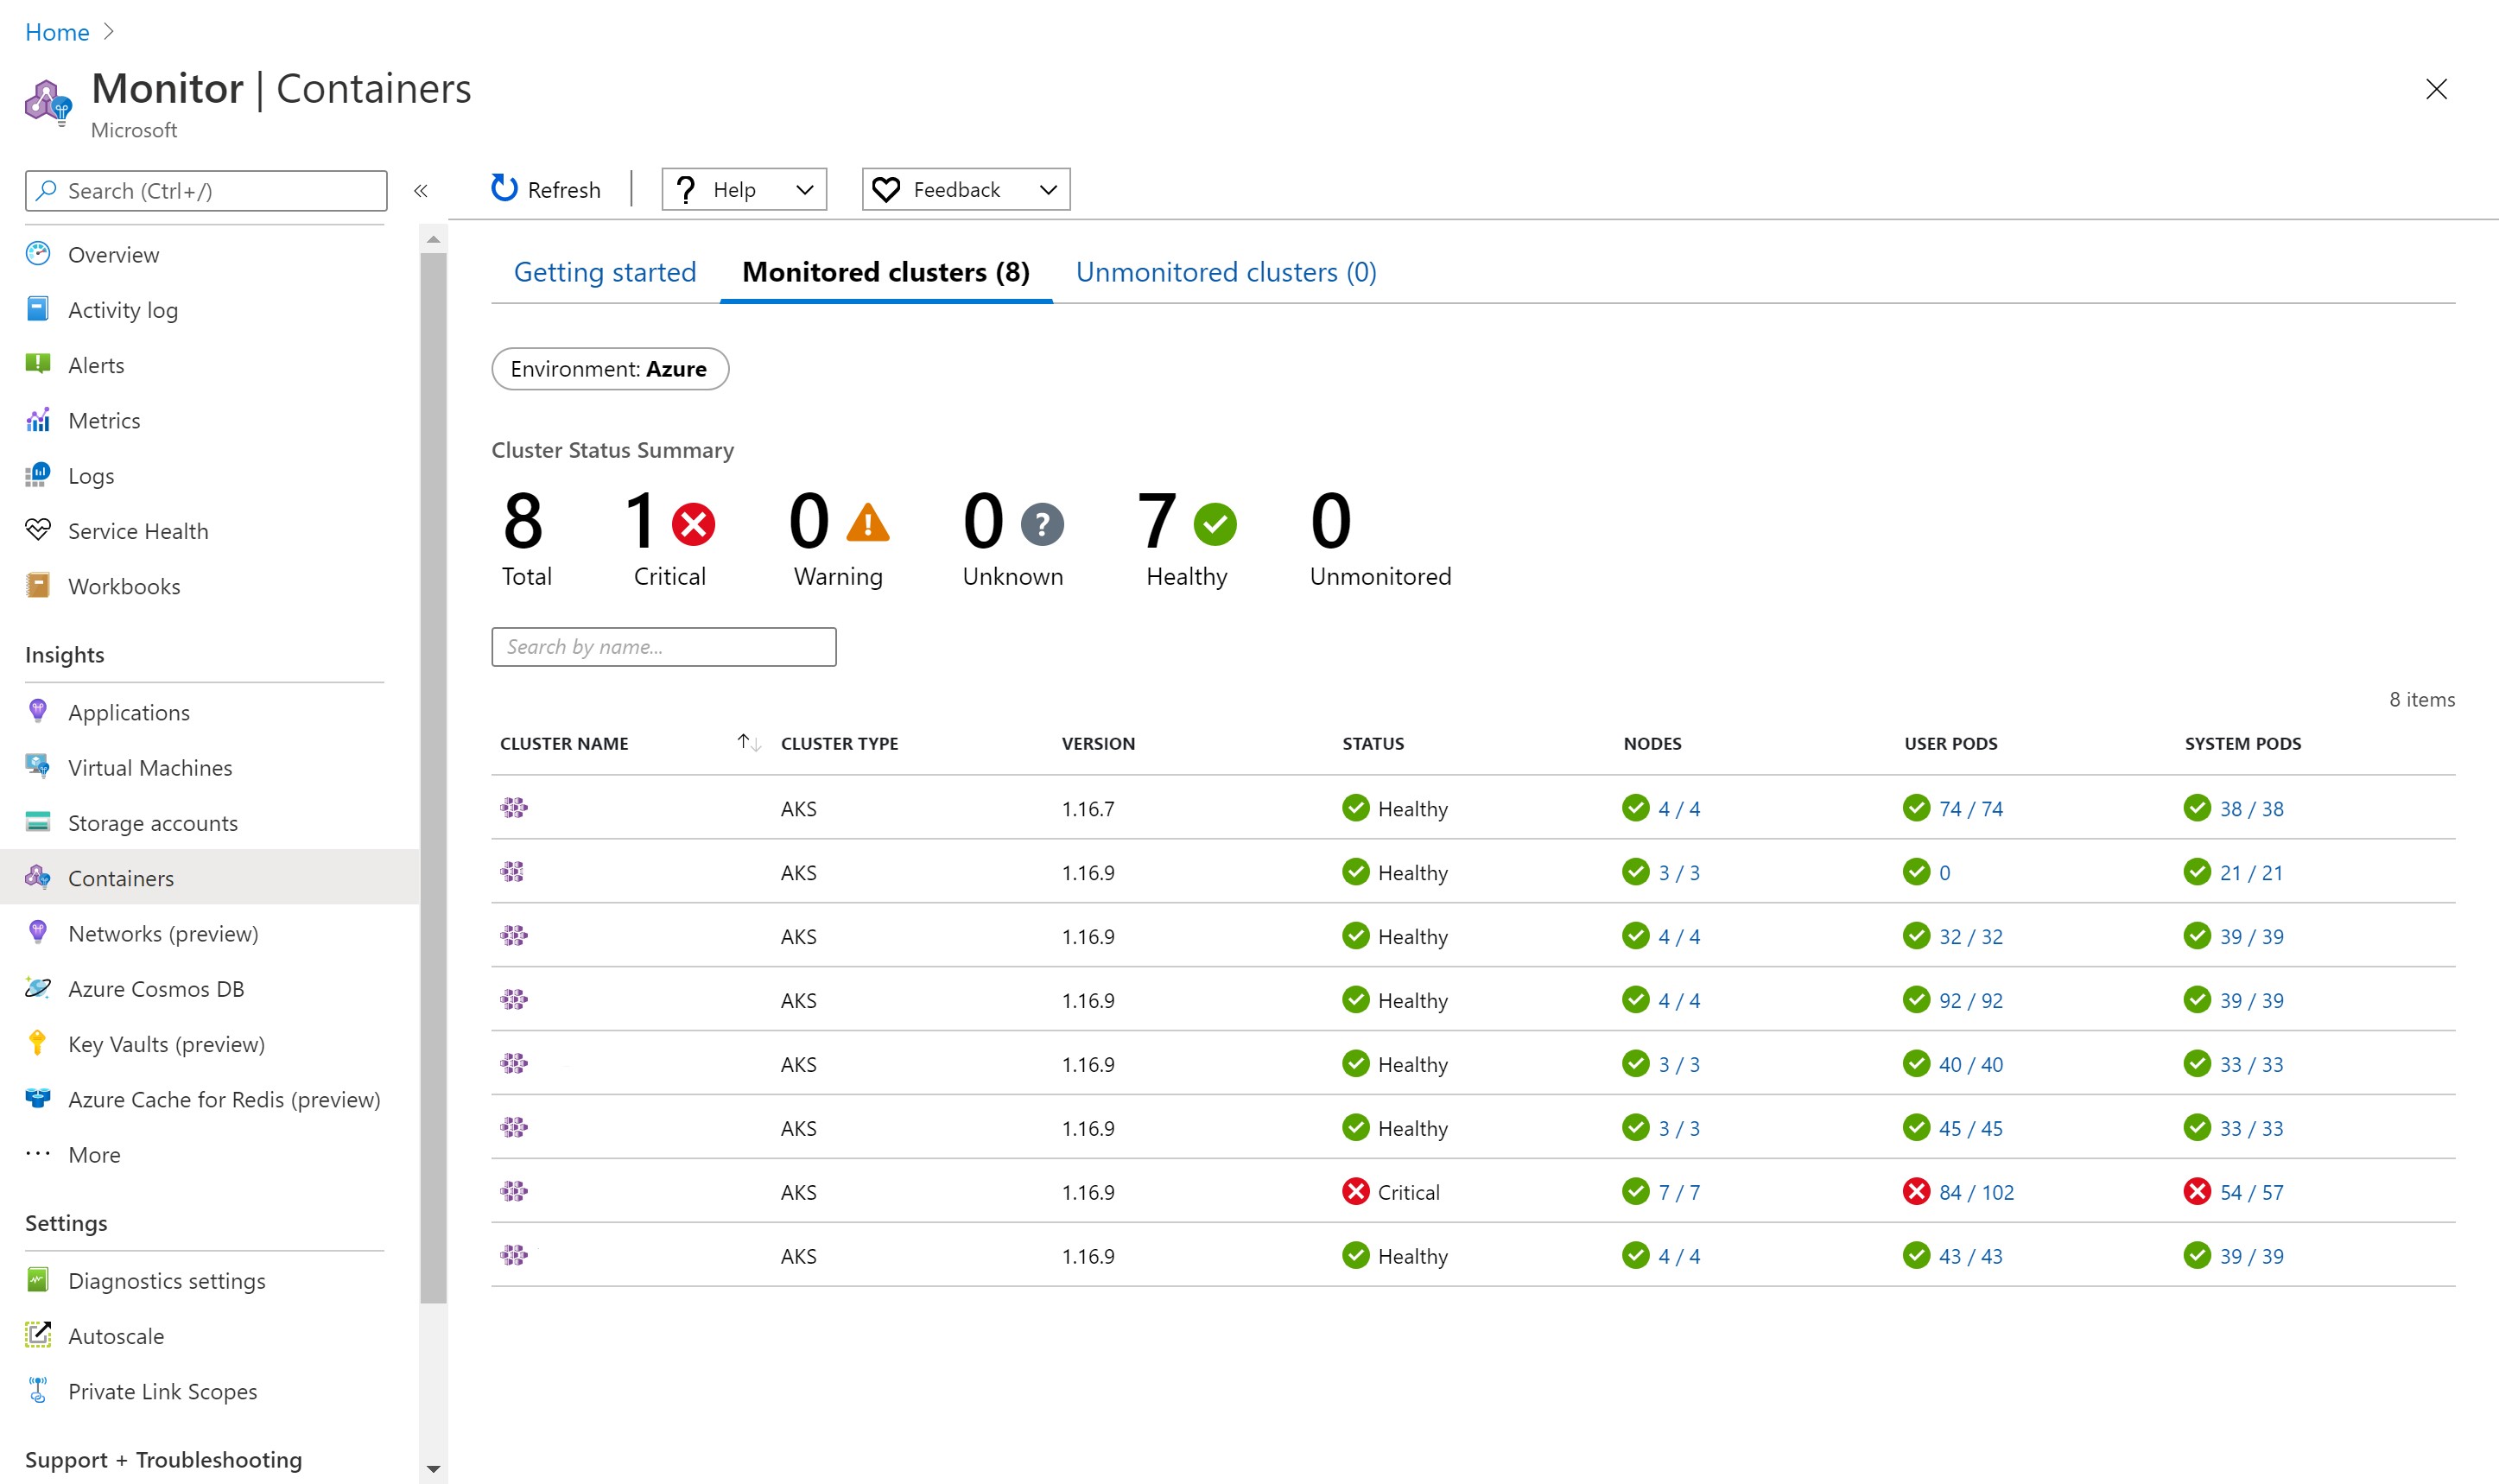
Use Azure Monitors Insights for Containers overview to identify any unhealthy clusters quickly.
portal.azure.com/#blade/Microsoft_Azure_Monitoring/AzureMonitoringBrowseBlade/containerInsights
You can follow Controlling ingestion to reduce cost for official guidance.